Morning Consult
Trend Trackers
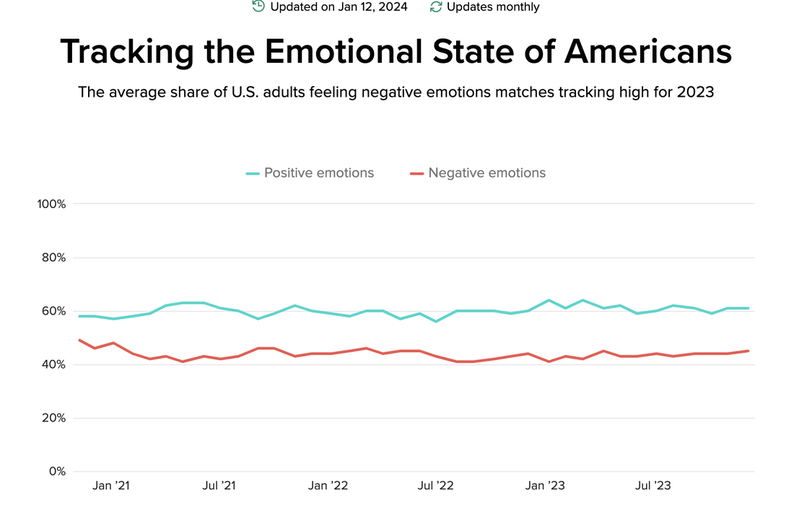
The Emotions Tracker was one of about 12 trend trackers that I managed while at Morning Consult. Every month, I'd analyze the survey data on the reported emotions among Americans, refresh the up to 21 charts in Everviz with the new data and schedule the page update in WordPress. I pitched adding more demographics to highlight the data we had. When MC Pro launched in May 2023, I reproduced the tracker in the new WordPress content management system along with almost a dozen other former and current trackers.
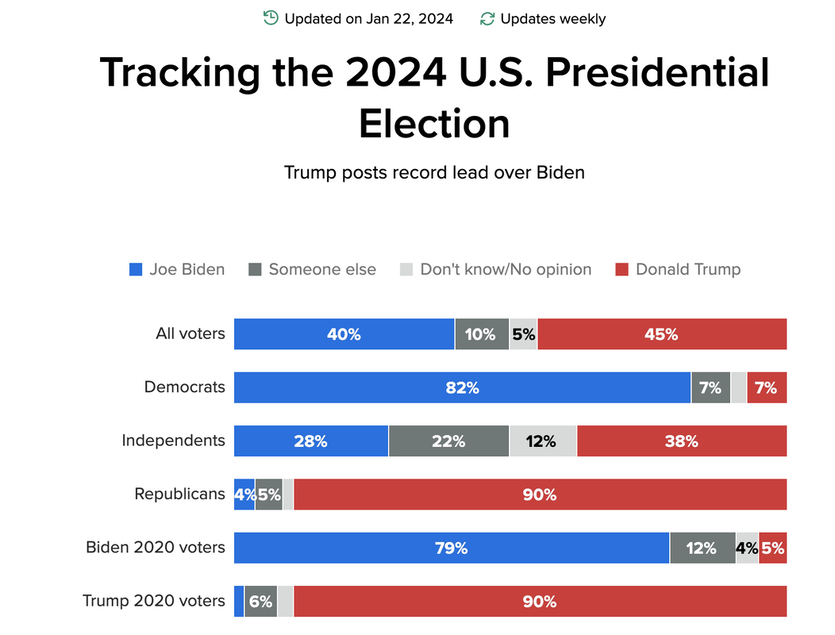
I built the 2024 U.S. Presidential Election Tracker in WordPress after receiving a request from the U.S. Politics team fora new tracker. I went beyond my usual responsibilities by setting up tabs for the charts in Everviz, including some special formatting to accommodate an ask to get different titles for individual charts in a tabbed format. I offered to update this tracker page in WordPress every week, along with a page specifically dedicated to the GOP primary, when we received new data.
Chart Pack
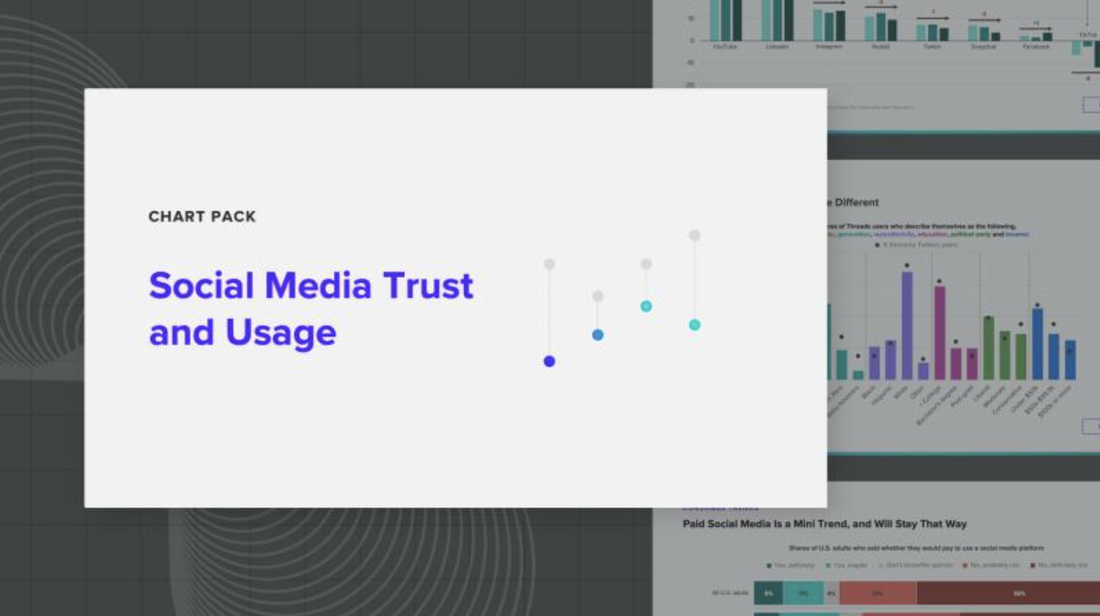
As a digital producer, I executed an idea from leaders to create a new PDF content type that compiled previously published charts into a presentation deck covering a timely topic. I pitched this chart pack as one of two highlighting public opinion on social media, with this one featuring more than a dozen charts that I found across 11 reports and articles. For six chart packs, I assembled and designed the deck in PowerPoint and wrote the introduction and key takeaways for the landing page.
Street Sense
Adobe InDesign Page Design
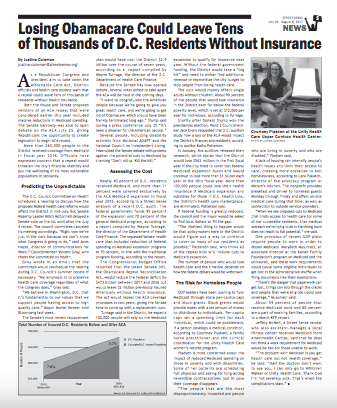
After researching how the potential of an Affordable Care Act repeal would affect D.C. and specifically the populations with lower incomes, I designed the page for my story in Adobe InDesign. I also did a photo shoot after one of my interviews with Courtney Pladsen and spent time researching data for a graphic and creating it in Adobe Illustrator.
Academic
Infographic
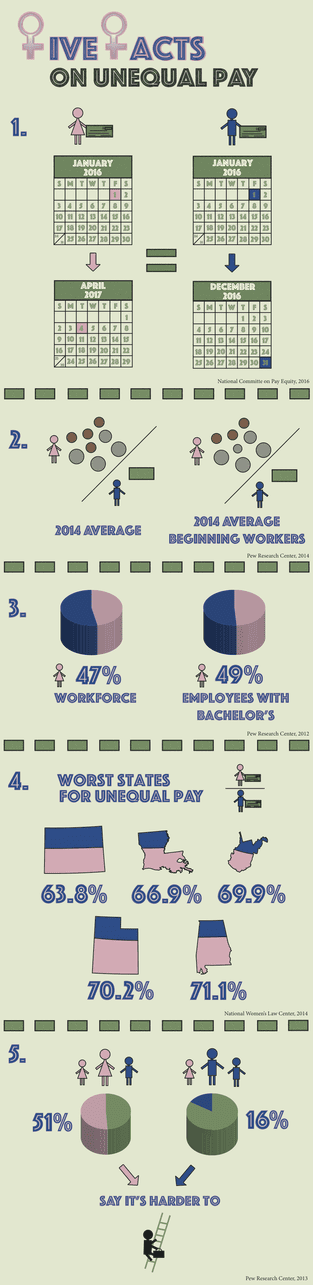
I created this infographic on the equal pay gap by creating all my own vectors, except for the state vectors. I had never used Adobe Illustrator before, but I wanted to learn the program, so I experimented for hours when developing my original vectors. I strengthened my visualization skills by envisioning numerical data from various sources to create the graphic.
|
© 2024 by Justine Coleman |
Header background courtesy of pixabay.com |
